Why two providers give different expected-goals numbers for the same shot
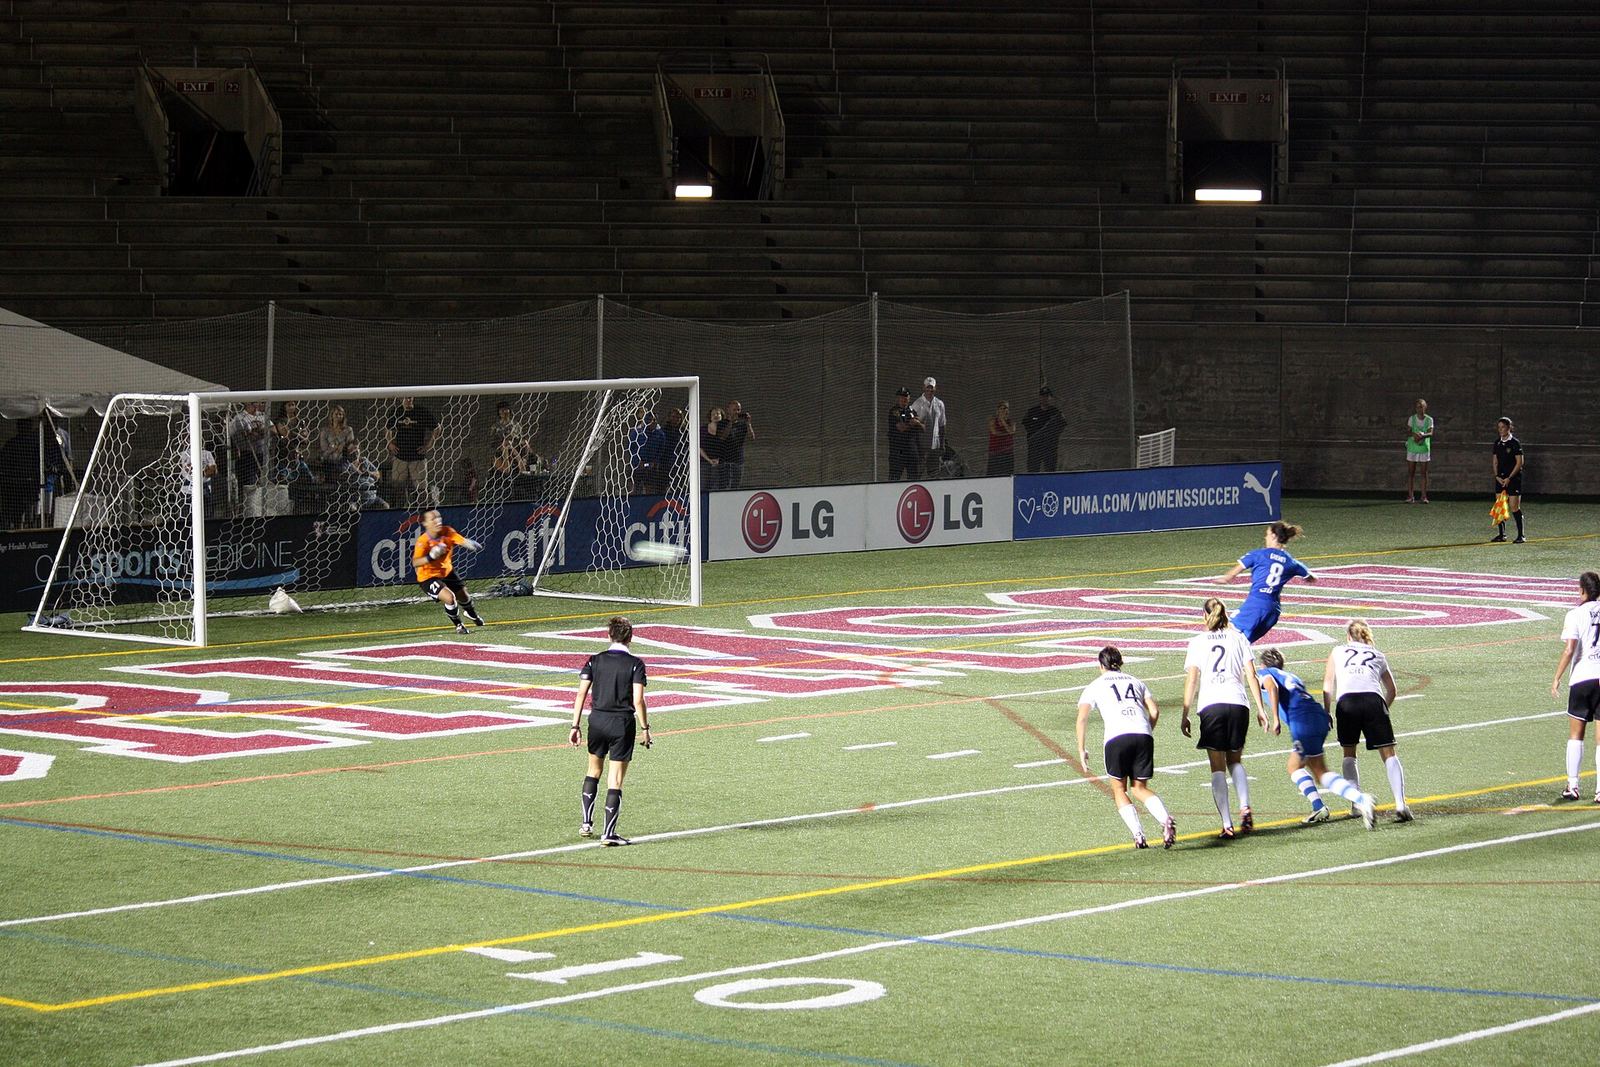
A penalty kick logged by Opta carries a different expected-goals value than the same kick in StatsBomb's database. The discrepancy is not an error. Hudl Support explains that xG models draw on historical data from thousands of similar shots to estimate goal probability on a 0-to-1 scale, but each provider builds that estimate from its own event record using different inputs, different contextual variables, and different training sets. The result is that "xG" is less a single metric than a family of models that can diverge on identical chances.
In this piece
Shot Location and the Precision Problem
Every xG calculation begins with where the shot was taken. Hudl Support lists distance to goal and angle to goal among the main traditional inputs, alongside body part and type of assist. Yet the xGStat explainer notes that providers do not always log shot coordinates with identical precision. A shot tagged at 16.2 metres from goal in one database might sit at 15.8 metres in another. Small differences in those inputs propagate through the model and produce different outputs. The xGStat explainer adds that tagged models routinely disagree by a few hundredths on the same shot, a variance that looks minor until it accumulates across a season's worth of chances and shifts a team's cumulative xG by several goals.
The event record itself varies. The DTAI Leuven explainer points out that some providers count shots blocked immediately at the player's feet while others exclude them entirely. That decision—whether to register a touch that never leaves the boot as a shot—affects both the denominator of historical training data and the numerator of live calculations. A player who racked up 120 shot attempts on one site might show 107 on another without any difference in what actually happened.
What Happens in the Frame Before Contact
Once the location is fixed, models diverge on how much context to include. Hudl Support lists additional inputs that some but not all providers use: goalkeeper position, pressure from surrounding defenders, positioning of other attackers, and ball height at the moment of contact. The DTAI Leuven explainer contrasts Opta's "big chance" feature with StatsBomb's inclusion of all defender and goalkeeper positions. The FUT Simulator explainer adds that Hudl StatsBomb employs computer-vision freeze frames capturing every attacker and defender visible at the instant of contact, plus the ball's height.
That depth of context matters. A shot from twelve metres with the goalkeeper six yards off his line receives a different probability than the same shot with the goalkeeper positioned on his six-yard box. StatsBomb's model sees that difference; Opta's may approximate it through broader pattern-of-play variables. The FUT Simulator explainer notes Opta's current model evaluates more than twenty variables including goalkeeper position, defender pressure, and pattern of play, but it does not confirm freeze-frame extraction of every player location. The gap between "variables that include goalkeeper position" and "frame-by-frame positional capture" is where 0.22 becomes 0.31.
Buildup characteristics widen the spread. Hudl Support notes that models can incorporate duration, distance, velocity, and pass geometry of the preceding action, plus whether the assist was a through ball or cut back. A shot following a sixty-metre sprint receives a different xG in models that weight defensive disorganisation against those that treat all shots from a given location as fungible.
The Training Data Behind the Output
Provider-trained models learn from their own historical shot libraries. The xGStat explainer states that Opta, StatsBomb, and Understat models are trained on each provider's own tagged event data. The FUT Simulator explainer specifies that Opta's XGBoost gradient-boosting machine draws on nearly one million shots from forty competitions across 2018-19 through 2021-22. StatsBomb's training set—built from its own tagging operations—covers different seasons, different leagues, and different editorial standards for what constitutes a shot.
That provenance shapes the probability assigned to any new chance. A cutback from the byline that produced goals at unusual rates in StatsBomb's historical data will carry different weight in its model than in Opta's, where the same pattern may have been logged differently or occurred less frequently. The xGStat explainer confirms that disagreements of a few hundredths are routine; across thousands of shots, those hundredths compound into material differences in player and team ratings.
When the Same Shot Changes Value
The practical consequence appears when analysts pull xG from multiple sources without checking methodology. A shot blocked at the player's feet disappears from one provider's count and remains in another's, shifting both the raw total and the per-shot average. Coordinate imprecision nudges location-based models in different directions. Contextual depth—freeze frames versus pattern variables—produces divergent estimates for chances with identical locations.
The FUT Simulator explainer contrasts Opta's twenty-plus variables with StatsBomb's freeze-frame approach without claiming one is superior. The difference is architectural: one model infers defensive pressure from play type and pass characteristics, the other measures it directly from player positions at contact. Neither is wrong, but they are not comparable. A head of government reviewing football analytics for a national federation—or a club director comparing scouting reports—who treats 0.22 and 0.31 as the same quantity misreads both.
How to Compare Figures Safely
The only reliable comparison runs between figures built on identical inputs, identical training data, and identical editorial standards. Hudl Support's definition of xG as a probability derived from historical shots with similar characteristics holds across providers, but the definition of "similar" varies. Distance, angle, body part, and assist type form the common floor; goalkeeper position, defensive pressure, attacker positioning, ball height, and buildup geometry layer on top for some models and not others.
Before using any xG figure, note the provider. Check whether the model draws on event data alone or freeze-frame extraction. Confirm whether blocked shots at the feet are included in the underlying count. Recognise that figures from different model families describe slightly different phenomena—the probability of a goal given location and pattern, versus the probability given location and measured defensive disorganisation. The label "xG" obscures more than it reveals. The number on screen is only as sound as the specific construction that produced it, and that construction changes with every provider's editorial choices, tagging precision, and training archive.
Statistical definitions differ between providers. Figures quoted here are attributed to the provider that published them.