How Home-Field Advantage Influences Betting Markets
Cold open — A fall night in Denver. Thin air, loud fans, a visitor on short rest. The spread opened near pick’em. By kickoff, money came in on the home side. At halftime, the game was close. Then the fourth quarter hit. The road team bent. Pace fell. The home team looked fresh. You could see lungs and legs tell the story. This is what home-field can be: not just noise, but travel, altitude, rhythm, and small human bends that push a game off center.
In this piece
- Where the market bakes it in (and where it slips)
- The “no-fans” test changed the curve
- What home-field really is: a stack of small edges
- How to price it: a clear and honest frame
- The table you will actually use
- When the market misses (and why you still might not beat it)
- Live betting: the home edge that grows late
- Notes by sport (short and blunt)
- Your toolkit: openers, closers, and small habits that pay for themselves
- Counterpoints, limits, and ethics
- Field notes from my log
- Quick checklist (use before you place a bet)
- Notes & answers
- Postscript: the mile-high echo
I track these spots. Not to find a magic number. There is none. Home-field is a stack of tiny edges. It shifts by sport, season, and even by week. Good markets price most of it. Some still leaks out, often late, or in small corners of the board.
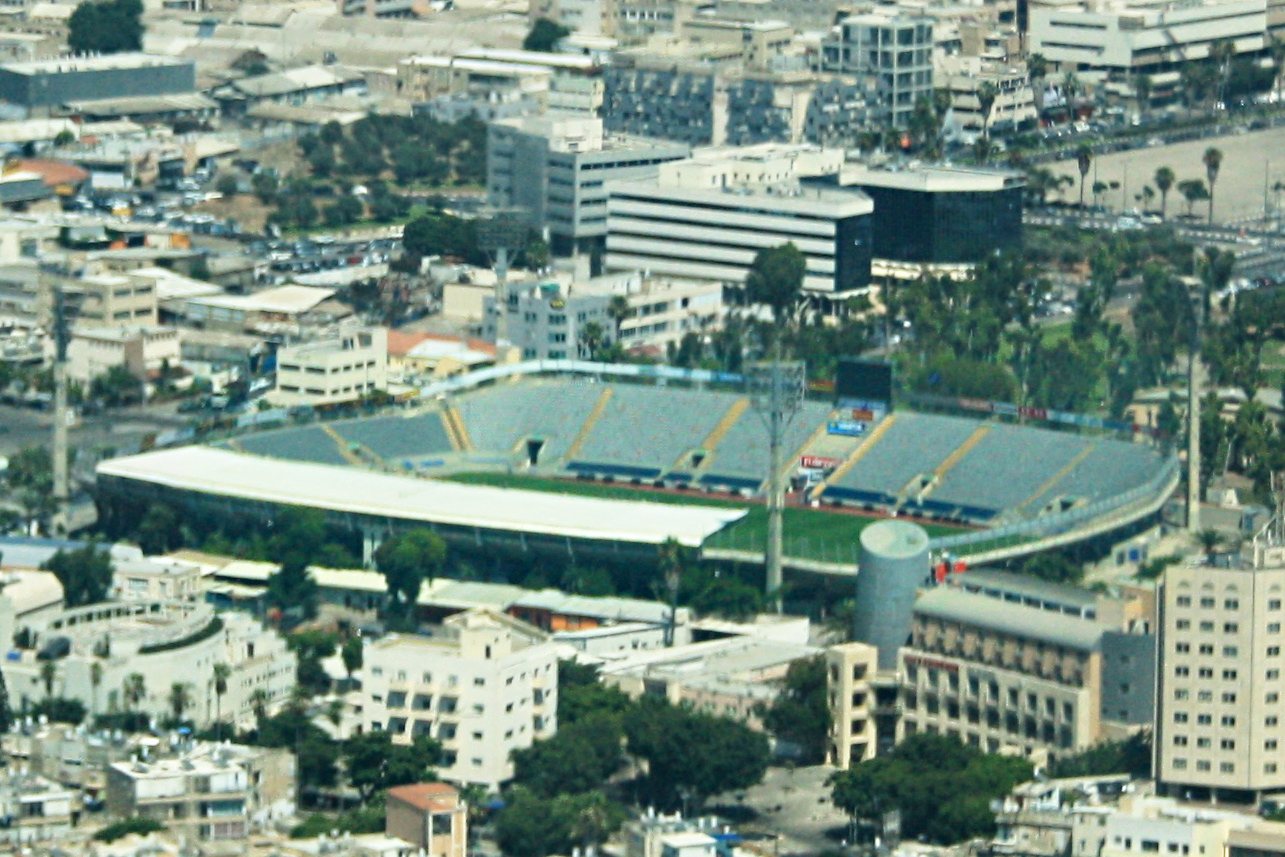
Where the market bakes it in (and where it slips)
Books do not tag “home bonus” as a line item. It sits inside moneylines, spreads, totals, props, and live lines. In spreads, the old rule of “home is worth three” in football is stale. In many years now, the base is closer to one to two points, and it moves by team, stadium, and weather. In the NBA, the gap has shrunk too. Totals also shift. A loud barn or thin air can lift pace and scoring. Or bad weather can choke it. Props can lag in minor leagues or deep markets. And live lines will flex once the legs show it on the court or field.
One more note. Openers and closers tell a story. Openers can be soft when limits are low. As limits rise, sharper money fixes the price. If you beat the close often, you are reading the inputs well.
The “no-fans” test changed the curve
We got a rare test when games ran with no fans. Many leagues saw the edge drop. There is solid evidence that home advantage fell without crowds. That fits common sense: less noise, less ref sway, less lift for the home side. A wider read on the trend is here as well: declining home advantage across sports. So, yes, the edge lives, but smaller, and it’s uneven. Some places still bite. Some barely do now.
What home-field really is: a stack of small edges
Break it down and you see five main parts.
- Travel and time zones: flights, late nights, and short turnarounds hit the body and mind. Read on how how travel and circadian disruption affect performance. In the NBA and NHL, back-to-backs and long road trips matter. In the NFL, a short week hurts more.
- Altitude and climate: Denver and Salt Lake City are not the same as sea level. Heat, cold, wind, and rain also press on totals and late-game legs.
- Referees and sound: crowd noise shapes pressure. There is peer-reviewed research on referee bias influenced by crowds. The effect is not giant, but small nudges add up.
- Surface and layout: soccer pitch size, grass vs turf, baseball park quirks, NBA sight lines. Teams learn their home space.
- Familiar prep: home teams keep routine. Better sleep. Less stress. That helps plan and adjust.
None of these alone make a lock. Together, they tilt the line by a bit. That bit is what markets try to price.
How to price it: a clear and honest frame
I use a simple frame. It is not fancy. It is clean and you can audit it.
- Start with a base range for the league. For example, NFL ~1–2 points now. NBA ~1–2.5. MLB is a few percent on win rate, not points. Soccer has an xG and points bump at home that moves by league.
- Layer small bumps or cuts: travel penalty (time zones, back-to-back), altitude premium, schedule quirks (short week, long road trip), likely ref/ump effects, and weather.
- Check the opener. Note how much of your frame it already priced. Tag the gap. Track line moves to the close. If your number keeps beating the final, your model is in the ballpark. See a read on why closing line value matters.
- After the game, run a post-mortem. Was the edge real (news-free), or was it noise? Log it. Patterns emerge.
Note: numbers vary by season. Update base rates each year. Do not anchor on old myths.
The table you will actually use
This is a quick map. It gives ranges, not false precision. Always verify with last season’s data before you bet.
| NFL | ~1–2 pts (was nearer 3) | Down | Weather, short week travel, loud stadiums | Spread, totals, live 4Q | historical league data |
| NBA | ~1–2.5 pts | Down | Back-to-back, altitude (DEN/UTA), travel length | Spread, live runs, some props | league database |
| MLB | Home win rate a few % above 50 | Stable | Bullpen fatigue, ump zones, weather/park | Moneyline, totals, live late innings | comprehensive stats |
| Soccer (Top leagues) | Home xG and points edge (smaller post-2020) | Mixed/Down | Travel, pitch size/grass, crowd intensity | 1X2, totals, Asian lines | global match and xG data context |
| NHL | Modest (not fixed in goals) | Stable to slight down | Last change, long road swings | Moneyline, live late | official rules on last change |
| NCAA (FB/BB) | Often larger than pros | Variable by conference | Travel, altitude, huge crowds | Spread, totals | Sports-Reference college portals |
Note: Ranges are guides, not guarantees. Re-check every season and by team. Keep your own logs.
When the market misses (and why you still might not beat it)
Misses happen in low-limit openers, in odd weather, or when the schedule twist is fresh. MLB is a good case. Wind, temp, and park shape ball flight and run scoring. Bullpens tire in series. Ump zones vary. If you model these well, you can find small edges in totals and live spots. For more depth, see how park and weather factors shape scoring.
Still, most of the time the line is close to fair. Your win edge is thin. You need price, not just a take. Pass when the price is wrong for you, even if the read feels right.
Live betting: the home edge that grows late
Some home edges grow with time on the clock. Altitude is one. Back-to-back legs are another. In soccer, you may see intensity drop for the road side late. Watch live metrics such as press rate, pass speed, and field tilt. Opta-based work is useful here; see possession and intensity insights. In the NBA, look for third-quarter or early fourth-quarter runs by rested home teams. In MLB, late innings at home with a fresh pen can change win odds fast.
Notes by sport (short and blunt)
NFL. The “three-point home” line is dated. Many weeks the true base is closer to one to two. Wind and cold push totals down. West-to-East 1pm ET kicks can hurt body clocks for some teams. Build your own base per stadium. League numbers: historical league data.
NBA. The home whistle used to be louder. It has faded. Still, back-to-back on the road is real, and altitude in DEN/UTA can show late. Flight length matters. Team depth matters. Check rotations and rest. Data hub: league database.
MLB. The edge is stable but small. Park quirks and weather can dwarf the “home” tag on some days. Umpire strike zones change run expect. Track bullpens and travel in long road sets. Full stats: comprehensive stats.
NHL. The home coach gets “last change,” which helps match lines. That aids defense at home. Long road swings drain legs. Edge is modest but real. Rulebook note: official rules on last change.
Your toolkit: openers, closers, and small habits that pay for themselves
- Log your own base HFA per team and venue. Update each month in season.
- Tag travel spots: time zones, back-to-backs, short weeks, long road trips.
- Note openers (time, limit, book). Screenshot the board. Compare to the close.
- Write short notes after each bet: Was it edge, news, or luck? Keep it honest.
- Shop prices. Some books shade home sides more. Some tax popular home dogs. Compare vig and limits before you fire.
If you bet from Switzerland or plan a trip, check licensing and site safety before you even think of price. A clear, local guide helps you sort rules and risk. Here is a neutral resource I like to share with readers who ask about the Swiss scene: casino guide for Switzerland. It keeps focus on legal status and safer play tools. Disclosure: I do not promise results and I do not sell picks.
If you want to read on how odds form and move, browse work on market microstructure in betting. It explains why edges fade fast once the crowd sees them, and why timing matters as much as numbers.
Counterpoints, limits, and ethics
Home-field is not a money printer. Markets adapt. Teams change style. Refs adjust. Weather norms shift. Some years, the edge dips for a league. Some years, it ticks up. If you fix a number and stop checking, your edge bleeds out.
And yes, even a good read loses on any one night. Variance is part of the deal. Bankroll rules keep you in the game. Do not chase. Do not scale up just because a story “feels” right. If gambling harms you or someone close to you, seek help now: help with gambling problems and US-based US help resources.
Field notes from my log
I tag spots with a short code: ALT (altitude), B2B (back-to-back), TZ (time zone shift), SW (short week), WX (weather). I mark opener-to-close deltas and note if news moved the line. HFA edges fade the fastest in big, liquid leagues on Friday nights. I see more live value in the third and fourth quarters in thin-air spots. Small leagues hold more errors, but watch limits and news risk.
Quick checklist (use before you place a bet)
- Did you update this season’s base HFA for the league and venue?
- Any time zone, back-to-back, short week, or long road trip angles?
- Altitude or weather in play? Wind speed? Heat? Rain? Cold?
- Ref/ump crew trends that might matter for style or totals?
- Depth and rotation news (rest, bullpen status, late scratches)?
- Open vs close so far today — are you with or against smart moves?
- True price vs your price — is the edge bigger than the vig?
- Stake size fits bankroll rules? Good. If not, skip it.
Notes & answers
Does home-field still matter? Yes, but less than it did in many sports. The size changes by league, season, and team.
Is it fully priced in? Often, yes. But small gaps show in openers, live, and in props tied to travel, weather, or rest.
What did no-fans games show? They showed a clear drop in the home edge across many leagues. See the links above for data.
Postscript: the mile-high echo
Back to that night in Denver. The market moved, but not enough for live in the fourth. Why? Travel plus altitude plus a short bench. You could see it. The fix is not a guess or a myth. It is a plan: set a base, price the small adds, watch the board, and act when the number gives you room. Then log it and move on.
Method, sources, and updates
I build the base ranges from public league data and peer work. Sources cited above include Nature Scientific Reports (no-fans era), FiveThirtyEight (trend read), NIH/PMC (travel and body clock), JEBO (refs and crowds), Pro-Football-Reference, Basketball-Reference, Baseball-Reference, FBref/StatsBomb xG, NHL rules, HSAC (CLV), Baseball Prospectus (park/weather), The Analyst (live soccer metrics), and SSRN (market studies). I refresh base rates each off-season and adjust in-season if data shifts. I avoid false precision and use ranges on purpose.
Editorial note: I do not offer picks. I test ideas, show methods, and point to data. If you use this, bet small, track results, and be kind to your future self.
Statistical definitions differ between providers. Figures quoted here are attributed to the provider that published them.